Advanced Trend and Volatility Indicator with Alerts by ZaimonThis script presents a comprehensive analytical tool that integrates multiple technical indicators to provide a holistic view of market trends and volatility. By uniquely combining Moving Averages (MA), Relative Strength Index (RSI), Stochastic Oscillator, Bollinger Bands, and Average True Range (ATR), it offers nuanced insights into price movements and helps identify potential trading opportunities.
---
### **Key Features and Integration:**
1. **Moving Averages (MA20 & MA50):**
- **Trend Identification:**
- **Methodology:** Calculates two Simple Moving Averages—MA20 (short-term) and MA50 (long-term).
- **Bullish Trend:** When MA20 crosses above MA50, indicating upward momentum.
- **Bearish Trend:** When MA20 crosses below MA50, signaling downward momentum.
- **Golden Cross & Death Cross Alerts:**
- **Golden Cross:** MA20 crossing above MA50 generates a bullish alert and visual symbol.
- **Death Cross:** MA20 crossing below MA50 triggers a bearish alert and visual symbol.
- **Integration:**
- Serves as the foundational trend indicator, influencing interpretations of other indicators within the script.
2. **Relative Strength Index (RSI):**
- **Momentum Measurement:**
- **Methodology:** Calculates RSI to assess the speed and change of price movements over a 14-period length.
- **Overbought/Oversold Conditions:** Customizable thresholds set at 70 (overbought) and 30 (oversold).
- **Alerts:**
- Generates alerts when RSI crosses above or below the specified thresholds.
- **Integration:**
- Confirms trend strength identified by MAs.
- Overbought/Oversold signals can precede potential trend reversals, especially when aligned with MA crossovers.
3. **Stochastic Oscillator:**
- **Momentum and Reversal Signals:**
- **Methodology:** Uses %K and %D lines to evaluate price momentum relative to high-low range over recent periods.
- **Bullish Signal:** %K crossing above %D in oversold territory (below 20).
- **Bearish Signal:** %K crossing below %D in overbought territory (above 80).
- **Alerts:**
- Provides alerts on bullish and bearish crossovers in extreme regions.
- **Integration:**
- Enhances RSI signals by providing additional momentum confirmation.
- When both RSI and Stochastic indicate overbought/oversold conditions, it strengthens the likelihood of a reversal.
4. **Bollinger Bands:**
- **Volatility Visualization:**
- **Methodology:** Plots upper and lower bands based on standard deviations from a moving average (BB Basis).
- **Dynamic Support/Resistance:** Prices touching or exceeding the bands may indicate potential reversals.
- **Integration:**
- Works with RSI and Stochastic to identify overextended price movements.
- Helps in assessing volatility alongside trend and momentum indicators.
5. **Average True Range (ATR):**
- **Volatility Assessment:**
- **Methodology:** Calculates ATR over a 14-period length to measure market volatility.
- **ATR Bands:** Plots upper and lower bands relative to the current price using an ATR multiplier.
- **Integration:**
- Assists in setting stop-loss and take-profit levels based on current volatility.
- Complements Bollinger Bands for a comprehensive volatility analysis.
6. **Information Table:**
- **Real-Time Data Display:**
- Shows current values of MA20, MA50, RSI, Stochastic %K and %D, BB Basis, ATR, and Trend Status.
- **Trend Status Indicator:**
- Displays "Bullish," "Bearish," or "Sideways" based on MA conditions.
- **Integration:**
- Provides a consolidated view for quick decision-making without analyzing individual indicators separately.
7. **Periodic Labels:**
- **Enhanced Visibility:**
- Adds labels every 50 bars showing RSI and Stochastic values.
- **Integration:**
- Helps track momentum changes over time and spot longer-term patterns.
---
### **How the Components Work Together:**
- **Synergistic Analysis:**
- **Trend Confirmation:** MA crossovers establish the primary trend, while RSI and Stochastic confirm momentum within that trend.
- **Volatility Context:** Bollinger Bands and ATR provide context on market volatility, refining entry and exit points suggested by trend and momentum indicators.
- **Signal Strength:** Concurrent signals from multiple indicators increase confidence in trading decisions.
---
### **Usage Guidelines:**
1. **Trend Analysis:**
- **Identify Trend Direction:**
- Observe MA20 and MA50 crossovers.
- Refer to the Trend Status in the information table.
- **Confirm with Momentum Indicators:**
- Ensure RSI and Stochastic support the identified trend.
2. **Entry and Exit Points:**
- **Overbought/Oversold Conditions:**
- Look for RSI and Stochastic reaching extreme levels.
- Consider entering positions when oversold in a bullish trend or overbought in a bearish trend.
- **Bollinger Band Interactions:**
- Use price interactions with Bollinger Bands to identify potential reversal zones.
3. **Risk Management:**
- **ATR-Based Levels:**
- Set stop-loss and take-profit levels using ATR bands to account for current volatility.
- **Adjusting to Volatility:**
- Modify position sizes and targets based on Bollinger Band width and ATR values.
4. **Alerts Setup:**
- **Customize Alert Thresholds:**
- Configure alerts for MA crossovers, RSI levels, and Stochastic crossovers according to your trading strategy.
- **Stay Informed:**
- Use alerts to monitor key events without constant chart observation.
---
### **Customization:**
- **Flexible Parameters:**
- All indicator lengths, thresholds, and settings are adjustable to suit different trading styles and timeframes.
- **Adjustable Visuals:**
- Modify plot colors, line styles, and label positions to enhance chart readability.
---
### **Originality and Value Addition:**
This script differentiates itself by:
- **Integrated Approach:**
- Seamlessly combining multiple indicators to provide a more comprehensive analysis than using each indicator separately.
- **Enhanced Visualization:**
- Utilizing plots, fills, labels, and an information table to present data intuitively.
- **User-Friendly Features:**
- Pre-configured alerts and real-time data displays reduce the need for manual monitoring.
By explaining how each component interacts and contributes to the overall analysis, the script adds substantial value to traders seeking a multi-faceted tool for market analysis.
---
### **Additional Notes:**
- **Learning Resource:**
- The script is well-commented, serving as an educational tool for those learning Pine Script and technical analysis integration.
- **Further Enhancements:**
- Opportunities exist to incorporate additional indicators like MACD or ADX, and to develop advanced alert logic, such as RSI or Stochastic divergences.
---
### **Disclaimer:**
- **Educational Purpose Only:**
- This script is provided for informational purposes and should not be construed as financial advice.
- **Risk Acknowledgment:**
- Trading involves significant risk; past performance is not indicative of future results.
- **Due Diligence:**
- Users should conduct their own analysis and consider consulting a financial professional before making trading decisions.
---
By providing detailed explanations of the methodologies and the synergistic use of multiple indicators, this script aligns with TradingView's guidelines for originality and usefulness. It offers traders a unique tool that enhances market analysis through the thoughtful integration of technical indicators.
在脚本中搜索"THE SCRIPT"

[blackcat] L3 Bullish Grab SignalOVERVIEW
The " L3 Bullish Grab Signal" indicator is designed to identify bullish trends and potential buying opportunities in the market. It uses a combination of moving averages and custom calculations to generate signals. The indicator is set to not overlay on the price chart, meaning it will have its own panel below the main chart, and it updates based on the specified timeframe.
FEATURES
Input Parameters:
shortEmaPeriod: Default value is 13, used for the shorter-term EMA.
longEmaPeriod: Default value is 34, used for the longer-term EMA.
signalEmaPeriod: Default value is 5, used to smooth the difference between the short and long EMAs.
lookbackPeriod: Default value is 60, used to look back over a certain number of bars for specific calculations.
Variable Calculations:
priceWeightedAverage: Calculated as (close * 2 + high + low) / 4 * 10, a custom price point.
shortEma: EMA of priceWeightedAverage over the short period.
longEma: EMA of priceWeightedAverage over the long period.
signalEma: EMA of the difference between shortEma and longEma, smoothed over the signalEmaPeriod.
oscillatorValue: Calculated as 2 * (shortEma - longEma - signalEma) * 5.5, a custom oscillator.
positiveOscillatorValue: Positive part of oscillatorValue, setting negative values to zero.
bullishSignal: True when positiveOscillatorValue increases and was previously negative.
confirmedBullishSignal: True when the bullish signal is confirmed by certain conditions involving the oscillator values and price increases.
priceIncreaseThreshold: Checks if the close price increased by more than 7% from the previous bar.
strongBullishSignal: Combines the bullish signal with the confirmed signal and the price increase threshold.
confirmedStrongBullishSignal: When all conditions for a strong bullish signal are met.
weakBullishSignal: Bullish signal that doesn't meet the strong criteria but still shows some strength.
Plotting:
Oscillator Value: Plots the raw oscillator value in white.
Positive Oscillator Value: Plots only the positive part of the oscillator value in white.
Strong Bullish Signal Stick: Plots a red candlestick when a strong bullish signal is confirmed, using the highest positive oscillator value over the lookback period.
Bullish Signal Stick: Plots a white candlestick for a bullish signal that isn't necessarily strong.
Weak Bullish Signal Stick: Plots a green candlestick for a weak bullish signal.
Positive Trend: Plots yellow candlesticks when the oscillator value is positive.
Negative Trend: Plots fuchsia candlesticks when the oscillator value is negative.
Numbers on Candles: Represents the breakout strength as a percentage change in price.
HOW TO USE
Install the Script: Add the script to your TradingView chart.
Customize Inputs:
Adjust the shortEmaPeriod, longEmaPeriod, signalEmaPeriod, and lookbackPeriod as needed.
Interpret the Charts:
Red Candles: Indicate a strong bullish trend, suggesting a potential buying opportunity.
White Candles: Indicate bullish signals that are not as strong but still suggest a buying opportunity.
Green Candles: Indicate weak bullish signals, suggesting a possible buying opportunity but with less confidence.
Yellow Candles: Indicate a positive trend, suggesting the market is in an uptrend.
Fuchsia Candles: Indicate a negative trend, suggesting the market is in a downtrend.
Numbers on Candles: Show the breakout strength as a percentage change in price.
Analyze Trends and Signals:
Use red candles to identify strong bullish signals, especially if the price has increased by more than 7% from the previous bar.
Monitor white and green candles for potential entries with lower confidence.
Avoid trading during fuchsia candles, as the market is in a downtrend.
MARKET MEANING AND TRADING USAGE
Strong Bullish Signal (Red Candles): Indicates a significant price increase and momentum, suggesting a strong buying opportunity.
Bullish Signal (White Candles): Suggests a buying opportunity but with less confidence compared to strong signals.
Weak Bullish Signal (Green Candles): Indicates a possible buying opportunity with even lower confidence.
Positive Trend (Yellow Candles): Suggests the market is in an uptrend.
Negative Trend (Fuchsia Candles): Suggests the market is in a downtrend.
Trading Strategy:
Buy: When a strong bullish signal is confirmed (red candle), especially if the price has increased by more than 7% from the previous bar.
Monitor: Watch for bullish signals (white candles) and weak bullish signals (green candles) for potential entries with lower confidence.
Avoid: During negative trends (fuchsia candles), as the market is in a downtrend.
LIMITATIONS
Simplicity: The implementation is based on a combination of moving averages and custom calculations, which might not capture all aspects of market dynamics.
Close Price Dependency: Uses close prices to determine trends and signals, which might not reflect intrabar price movements and trade imbalances accurately.
Historical Data: The script is based on historical data and does not guarantee future performance.
NOTES
Educational Tool: The script is designed for educational purposes and should not be considered financial advice.
Backtesting: Users are encouraged to backtest the strategy on a demo account before applying it to live trades.
Complementary Use: Best used in conjunction with other indicators and analysis methods for more accurate trading decisions.
THANKS
Special thanks to the TradingView community for their support and feedback.

DIN: Dynamic Trend NavigatorDIN: Dynamic Trend Navigator
Overview
The Dynamic Trend Navigator script is designed to help traders identify and capitalize on market trends using a combination of Weighted Moving Averages (WMA), Volume Weighted Average Price (VWAP), and Anchored VWAP (AVWAP). The script provides customizable settings and flexible alerts for various crossover conditions, enhancing its utility for different trading strategies.
Key Features
- **1st and 2nd WMA**: Allows users to set and visualize two Weighted Moving Averages. These can be customized to any period, providing flexibility in trend identification.
- **VWAP and AVWAP**: Incorporates both VWAP and AVWAP, offering insights into price levels adjusted by volume.
- **ATR and ADX Indicators**: Includes the Average True Range (ATR) and Average Directional Index (ADX) to help assess market volatility and trend strength.
- **Flexible Alerts**: Configurable buy and sell alerts for any crossover condition, making it versatile for various trading strategies.
How to Use the Script
1. **Set the WMA Periods**: Customize the periods for the 1st and 2nd WMAs to suit your trading strategy.
2. **Enable VWAP and AVWAP**: Choose whether to include VWAP and AVWAP in your analysis by enabling the respective settings.
3. **Configure Alerts**: Set up alerts for the desired crossover conditions (WMA, VWAP, AVWAP) to receive notifications for potential trading opportunities.
4. **Monitor Signals**: Watch for buy and sell signals indicated by triangle shapes on the chart, which appear at the selected crossover points.
When to Use
- **Best Time to Use**: The script is most effective in trending markets where price movements are well-defined. It helps traders stay on the right side of the trend and avoid false signals during periods of low volatility.
- **When Not to Use**: Avoid using the script in choppy or sideways markets where price action lacks direction. The script may generate false signals in such conditions, leading to potential losses.
Benefits of VWAP and AVWAP
- **VWAP**: The Volume Weighted Average Price provides a price benchmark that adjusts for volume, helping traders identify fair value levels. It is particularly useful for intraday trading and gauging market sentiment.
- **AVWAP**: The Anchored VWAP allows traders to set a starting point for VWAP calculations, providing flexibility in analyzing price levels over specific periods or events. This helps in identifying key support and resistance levels based on volume.
Unique Aspects
- **Customizability**: The script offers extensive customization options for WMA periods, VWAP, AVWAP, and alert conditions, making it adaptable to various trading strategies.
- **Combining Indicators**: By integrating WMAs, VWAP, AVWAP, ATR, and ADX, the script provides a comprehensive view of market conditions, enhancing decision-making.
- **Real-Time Alerts**: The flexible alert system ensures traders receive timely notifications for potential trade setups, improving responsiveness to market changes.
Examples
- **Example 1**: A trader sets the 1st WMA to 8 and the 2nd WMA to 100, enabling the VWAP. When the 1st WMA crosses above the 2nd WMA or VWAP, a buy signal is triggered, indicating a potential long entry.
- **Example 2**: A trader sets the AVWAP to start 30 bars ago and monitors for crossovers with the 1st WMA. When the 1st WMA crosses below the AVWAP, a sell signal is triggered, suggesting a potential short entry.
Final Notes
The Dynamic Trend Navigator script is a powerful tool for traders looking to enhance their market analysis and trading decisions. Its unique combination of customizable indicators and flexible alert system sets it apart from other scripts, making it a valuable addition to any trader's toolkit.
Disclaimer: Never any financial advice. Just ThisGirl loving experimenting with indicators to help myself, as well as others.

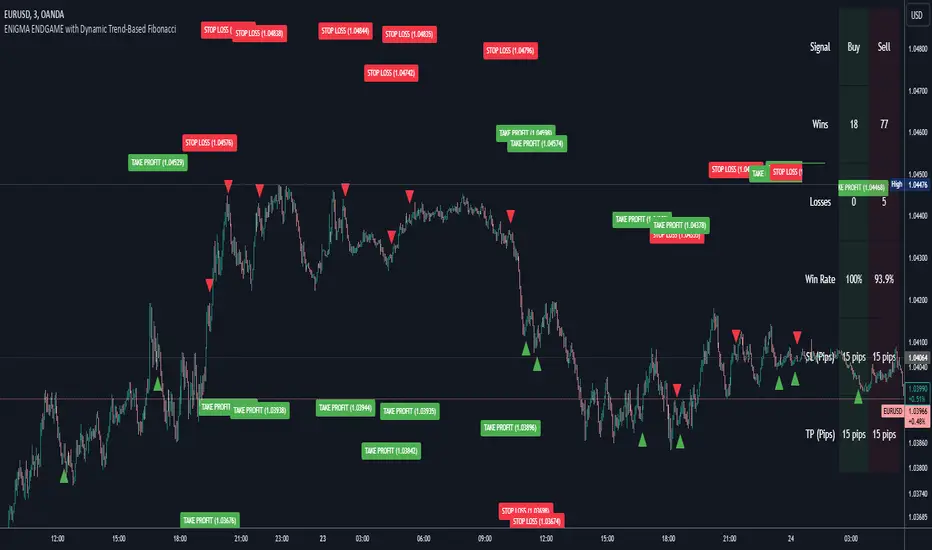
Enigma Endgame with Dynamic Trend-Based FibonacciThe Enigma Endgame script combines dynamic trend-based Fibonacci levels with the core principles of the ENIGMA strategy. It provides traders with actionable signals by identifying key levels of fractal support and resistance and highlighting opportunities to trade with market momentum. This tool is designed for multi-timeframe analysis and is especially effective during high-volatility sessions like London and New York.
Purpose and Usefulness
This script was developed to simplify complex market dynamics by integrating Fibonacci principles with ENIGMA's logic of fractal support and resistance. Traders can use it to:
- Identify key breakout and retracement levels dynamically.
- Understand the shift between support and resistance as price action evolves.
- Gain confidence in their entries with real-time signals derived from logical fractal behavior.
By merging Fibonacci levels with fractal-based trading insights, this script offers a unique and comprehensive approach to analyzing market structure.
How It Works
The script uses a dual approach to provide insights:
1. Dynamic Fibonacci Levels:
- Automatically plots Fibonacci retracement and extension levels based on recent high and low swings, adjusting dynamically to current market trends.
- Allows traders to visualize key levels where price might reverse or extend.
2. Fractal Support and Resistance Logic:
- The script identifies fractal support and resistance by analyzing candle formations.
- When a candle body closes below the low of a previous candle, the previous low, which was fractal support, now becomes fractal resistance. The script generates a bearish signal, encouraging traders to look for sell opportunities at or above the previous low.
- Conversely, when a candle body closes above the high of a previous candle, the previous high, which was fractal resistance, becomes fractal support. The script generates a bullish signal, encouraging traders to look for buy opportunities at or below the previous high.
Real-Time Signals
The script marks these transitions with arrows on the chart:
- Bearish arrows indicate broken fractal support turning into resistance.
- Bullish arrows** indicate broken fractal resistance turning into support.
These signals help traders stay aligned with the trend and trade with market momentum.
Key Features
1. Session-Based Analysis: Focuses on high-probability setups by allowing traders to customize session times, such as London or US sessions.
2. Multi-Timeframe Support: Works seamlessly across multiple timeframes for both scalpers and swing traders.
3. Real-Time Alerts: Sends customizable alerts when price interacts with critical Fibonacci levels or fractal support/resistance shifts.
How to Use the Script
1. Apply the script to a clean chart for clear visualization. Avoid combining it with other scripts unless necessary.
2. Use the arrows to identify shifts in fractal support and resistance and validate opportunities for buy/sell trades.
3. Monitor the dynamic Fibonacci levels to find confluence with key price areas.
4. Customize session times to focus on high-probability trading hours.
Key Notes for Traders
- This script provides insights based on logical market structure but should be used alongside proper risk management and trading plans.
- The fractal-based approach works well in conjunction with dynamic Fibonacci levels, helping traders build confidence in their strategy.
- Adapt the script settings to match your unique trading style and timeframe preferences.
By offering a seamless integration of fractal logic and Fibonacci principles, Enigma Endgame empowers traders with actionable insights to navigate markets effectively.
Support and Resistance TrendlinesStrategy:
Support: Identified as the lowest low over a specific period.
Resistance: Identified as the highest high over a specific period.
Dynamic Trendlines: We’ll use the concept of a rolling window to calculate the highest highs and lowest lows over the last n bars (you can adjust the number of bars for more sensitivity).
Explanation:
Lookback Period (length): The number of bars over which we calculate the support and resistance levels. You can adjust this value depending on the timeframe and the sensitivity you want for the trendlines.
Resistance: This is the highest high over the length of bars. We use ta.highest(high, length) to find the highest high within the specified lookback period.
Support: This is the lowest low over the length of bars. We use ta.lowest(low, length) to find the lowest low within the specified lookback period.
Plotting the Lines:
We plot the support and resistance as horizontal lines on the chart using plot().
Additionally, we create dynamic trendlines that update automatically with each new bar. The line.new function creates lines that can be modified dynamically as new price data comes in.
Line Persistence:
The line functions are used to create horizontal lines that persist across bars. The trendlines adjust their position as the bars move forward.
How It Works:
This indicator will automatically detect the highest and lowest prices over the last n bars and draw support (green line) and resistance (red line) levels on the chart.
The trendlines will adjust as the market evolves and provide visual reference points for potential areas of price reversal.
How to Use This Script:
Copy and paste the Pine Script code into the Pine Script Editor on TradingView.
Save the script, and then add it to your chart.
Adjust the Lookback Period input to suit your trading strategy and timeframe.
The support and resistance levels will be drawn dynamically, and the lines will update as new bars form.
Customizations:
You can modify the number of bars (length) used to calculate support and resistance, depending on the timeframes you're interested in.
If you need more advanced trendline drawing (such as drawing trendlines between significant high/low points or automatic adjustment to more complex patterns), you might need to implement more advanced logic using peaks and valleys or price action patterns.
Let me know if you need any further adjustments!

[blackcat] L1 Extreme Shadows█ OVERVIEW
The Pine Script provided is an indicator designed to detect market volatility and extreme shadow conditions. It calculates various conditions based on simple moving averages (SMAs) and plots the results to help traders identify potential market extremes. The primary function of the script is to provide visual cues for extreme market conditions without generating explicit trading signals.
█ LOGICAL FRAMEWORK
Structure:
1 — Input Parameters:
• No user-defined input parameters are present in this script.
2 — Calculations:
• Calculate Extreme Shadow: Checks if the differences between certain SMAs and prices exceed predefined thresholds.
• Calculate Buy Extreme Shadow: Extends the logic by incorporating additional SMAs to identify stronger buy signals.
• Calculate Massive Bullish Sell: Detects massive bullish sell conditions using longer-term SMAs.
3 — Plotting:
• The script plots the calculated conditions using distinct colors to differentiate between various types of extreme shadows.
Data Flow:
• The close price is passed through each custom function.
• Each function computes its respective conditions based on specified SMAs and thresholds.
• The computed values are then summed and returned.
• Finally, the aggregated values are plotted on the chart using the plot function.
█ CUSTOM FUNCTIONS
1 — calculate_extreme_shadow(close)
• Purpose: Identify extreme shadow conditions based on 8-period and 14-period SMAs.
• Functionality: Computes the difference between the 8-period SMA and the close price, and the difference between the 14-period SMA and the 4-period SMA, relative to the 6-period SMA. Returns 2 if both conditions exceed 0.04; otherwise, returns 0.
• Parameters: close (price series)
• Return Value: Integer (0 or 2)
2 — calculate_buy_extreme_shadow(close)
• Purpose: Identify more robust buy signals by evaluating multiple SMAs.
• Functionality: Considers the 8-period SMA along with additional SMAs (21, 42, 63, 84, 105) and combines multiple conditions to provide a comprehensive buy signal.
• Parameters: close (price series)
• Return Value: Integer (sum of conditions, ranging from 0 to 14)
3 — calculate_massive_bullish_sell(close)
• Purpose: Detect massive bullish sell conditions using longer-term SMAs.
• Functionality: Evaluates conditions based on the 8-period SMA and longer-term SMAs (88, 44, 22, 11, 5), returning a sum of conditions meeting specified thresholds.
• Parameters: close (price series)
• Return Value: Integer (sum of conditions, ranging from 0 to 10)
█ KEY POINTS AND TECHNIQUES
• Advanced Pine Script Features:
• Multiple Nested Conditions: Uses nested conditions to assess complex market scenarios.
• Combination of Conditions: Combines multiple conditions to provide a more reliable signal.
• Optimization Techniques:
• Thresholds: Employs specific thresholds (0.04 and 0.03) to filter out noise and highlight significant market movements.
• SMA Comparisons: Compares multiple SMAs to identify trends and extreme conditions.
• Unique Approaches:
• Combining Multiple Time Frames: Incorporates multiple time frames to offer a holistic view of the market.
• Visual Distinction: Utilizes different colors and line widths to clearly differentiate between various extreme shadow conditions.
█ EXTENDED KNOWLEDGE AND APPLICATIONS
• Potential Modifications:
• User-Defined Thresholds: Allow users to customize thresholds to align with personal trading strategies.
• Additional Indicators: Integrate other technical indicators like RSI or MACD to improve the detection of extreme market conditions.
• Entry and Exit Signals: Enhance the script to generate clear buy and sell signals based on identified extreme shadow conditions.
• Application Scenarios:
• Volatility Analysis: Analyze market volatility and pinpoint times of extreme price action.
• Trend Following: Pair with trend-following strategies to capitalize on significant market moves.
• Risk Management: Adjust position sizes or stop-loss levels based on detected extreme conditions.
• Related Pine Script Concepts:
• Custom Functions: Demonstrates how to create reusable functions for simplified and organized code.
• Plotting Techniques: Shows effective ways to visualize data using color and styling options.
• Multiple Time Frame Analysis: Highlights the benefits of analyzing multiple time frames for a broader market understanding.

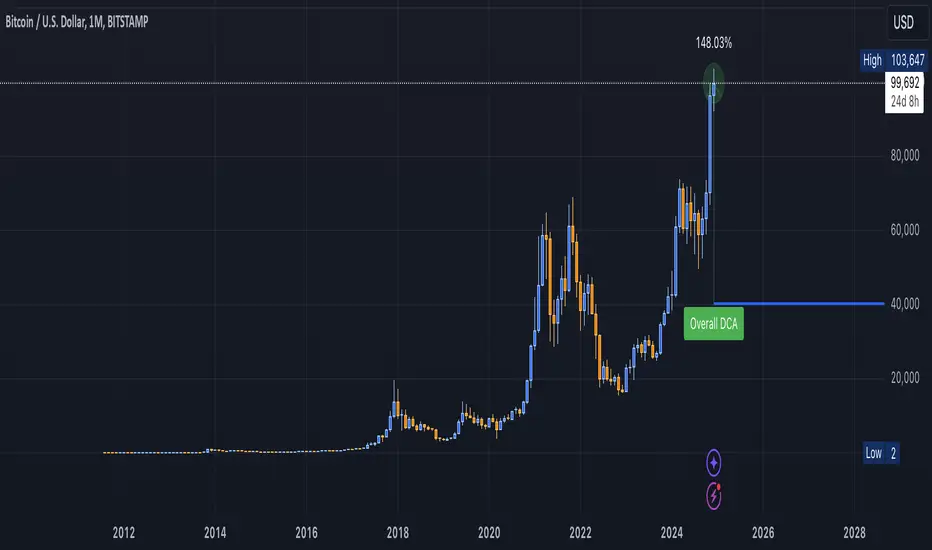
DCA Valuation & Unrealized GainsThis Pine Script for TradingView calculates and visualizes the relationship between a Dollar Cost Average (DCA) price and the All-Time High (ATH) price for over 50 different cryptocurrencies. Here's what it does:
1. Inputs for DCA Prices:
- Users can manually input DCA prices for specific cryptocurrencies (e.g., BTC, ETH, BNB).
2. Dynamic ATH Calculation:
- Dynamically calculates the ATH price for the current asset using the highest price in the chart's loaded data and persists this value across bars.
3. Percentage Change from DCA to ATH:
- Computes the percentage gain from the DCA price to the ATH price.
4. Visualizations:
- Draws a line at the DCA price and the ATH price, both extended to the right.
- Adds an arrow pointing from the DCA price to the ATH, offset by 10 bars into the future.
- Displays labels for:
- The percentage gain from DCA to ATH.
- "No DCA Configured" if no valid DCA price is set for the asset.
5. Color Coding:
- Labels and arrows are color-coded to indicate positive or negative percentage changes:
- Green for gains.
- Red for losses.
6. Adaptability:
- The script dynamically adjusts to the current asset based on its ticker and uses the corresponding DCA price.
This functionality provides traders with clear insights into their investment's performance relative to its ATH, aiding in decision-making.
-----
To add a new asset to the script:
1. Define the DCA Input: Add a new input for the asset's DCA price using the `input.float` function. For example:
dcaPriceNEW = input.float(title="NEW DCA Price", defval=0.1, tooltip="Set the DCA price for NEW")
2. Add the Asset Logic: Include a conditional check for the new asset in the ticker matching logic:
if str.contains(currentAsset, "NEW") and dcaPriceNEW != 0
dcaPrice := dcaPriceNEW
Where NEW is the ticker symbol of the asset you're adding.
NOTE: SOLO had to be put before SOL because otherwise the indicator was pulling the DCA price from SOL even on the SOLO chart. If you have a similar issue, try that fix.
Adding an asset requires only these two changes. Once done, the script dynamically incorporates the new asset into its calculations and visualizations.
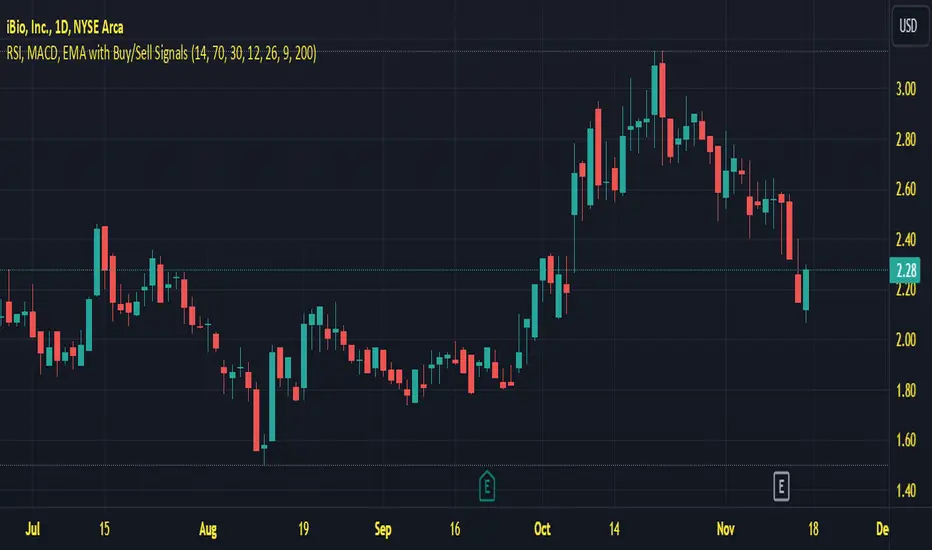
Last Freemans Ver1This script is a technical indicator for TradingView that combines three popular tools for analyzing price movements:
Relative Strength Index (RSI): This measures the momentum of recent price changes and indicates potential overbought or oversold conditions. The script allows you to adjust the RSI length (default 14) and define overbought (default 70) and oversold (default 30) levels.
Moving Average Convergence Divergence (MACD): This indicator helps identify trend direction and potential turning points. It uses two moving averages (fast and slow) and a signal line. The script lets you customize the lengths of the MACD lines (fast: 12, slow: 26, signal: 9).
Exponential Moving Average (EMA): This is a smoothing indicator used to identify the underlying trend by filtering out price noise. You can adjust the EMA length (default 200) in the script.
Additionally, the script generates Buy/Sell signals based on the following conditions:
Buy Signal:
MACD line crosses above the signal line (indicating a potential uptrend).
RSI is below the oversold level (suggesting room for price increase).
Closing price is below the EMA (potentially indicating a price pullback before an upswing).
Sell Signal:
MACD line crosses below the signal line (indicating a potential downtrend).
RSI is above the overbought level (suggesting potential for a price decrease).
Closing price is above the EMA (potentially indicating a price breakout before a decline).
Visualization:
The script plots the following on the chart:
RSI line (blue) with overbought and oversold levels as dashed lines (red and green, respectively).
MACD line (red) and signal line (blue).
EMA line (orange).
Green triangle up (below the bar) for Buy signals.
Red triangle down (above the bar) for Sell signals.
Important Note:
This script provides trading signals based on technical indicators, but keep in mind that these are not guaranteed predictions of future price movements. Always conduct your own research and consider other factors before making trading decisions.
[AWC] Vector -AYNETThis Pine Script code is a custom indicator designed for TradingView. Its purpose is to visualize the opening and closing prices of a specific timeframe (e.g., weekly, daily, or monthly) by drawing lines between these price points whenever a new bar forms in the specified timeframe. Below is a detailed explanation from a scientific perspective:
1. Input Parameters
The code includes user-defined inputs to customize its functionality:
tf1: This input defines the timeframe (e.g., 'W' for weekly, 'D' for daily). It determines the periodicity for analyzing price data.
icol: This input specifies the color of the lines drawn on the chart. Users can select from predefined options such as black, red, or blue.
2. Color Assignment
A switch statement maps the user’s color selection (icol) to the corresponding color object in Pine Script. This mapping ensures that the drawn lines adhere to the user's preference.
3. New Bar Detection
The script uses the ta.change(time(tf1)) function to determine when a new bar forms in the specified timeframe (tf1):
ta.change checks if the timestamp of the current bar differs from the previous one within the selected timeframe.
If the value changes, it indicates that a new bar has formed, and further calculations are triggered.
4. Data Request
The script employs request.security to fetch price data from the specified timeframe:
o1: Retrieves the opening price of the previous bar.
c1: Calculates the average price (high, low, close) of the previous bar using the hlc3 formula.
These values represent the key price levels for visualizing the line.
5. Line Drawing
When a new bar is detected:
The script uses line.new to create a line connecting the previous bar's opening price (o1) and the closing price (c1).
The line’s properties are defined as follows:
x1, y1: The starting point corresponds to the opening price at the previous bar index.
x2, y2: The endpoint corresponds to the closing price at the current bar index.
color: Uses the user-defined color (col).
style: The line style is set to line.style_arrow_right.
Additionally, the lines are stored in an array (lines) for later reference, enabling potential modifications or deletions.
6. Visual Outcome
The script visually represents price movements over the specified timeframe:
Each line connects the opening and closing price of a completed bar in the given timeframe.
The lines are drawn dynamically, updating whenever a new bar forms.
Scientific Context
This script applies concepts of time series analysis and visualization in financial data:
Time Segmentation: By isolating specific timeframes (e.g., weekly), the script provides a focused analysis of price behavior.
Price Dynamics: Connecting opening and closing prices highlights key price transitions within each period.
User Customization: The inclusion of inputs allows for adaptable use, accommodating different analytical preferences.
Applications
Trend Analysis: Identifies how price evolves between opening and closing levels across periods.
Market Behavior Comparison: Facilitates the observation of patterns or anomalies in price transitions over time.
Technical Indicators: Serves as a supplementary tool for decision-making in trading strategies.
If further enhancements or customizations are needed, let me know! 😊
Uphorico Candle RangesThis script allows you to see the high and low prices of a specific previous timeframe directly on your TradingView chart. You can choose which previous period to view—previous month, week, day, or last Monday—and the script will plot two horizontal lines for the high and low prices of that period. These lines help you quickly identify key levels based on past performance.
Features of the Script:
1. Select Previous Timeframe: You can choose between:
• Month: Shows the high and low of the previous month.
• Week: Shows the high and low of the previous week.
• Day: Shows the high and low of the previous day.
• Monday: Shows the high and low of the most recent Monday.
2. Line Customization:
• Color: Choose different colors for the high and low lines.
• Thickness: Adjust the line thickness (1–5).
• Style: Choose from solid, dashed, or dotted lines.
3. Touch Source Candle Option:
• If enabled, the lines will start directly at the last candle of the selected timeframe (e.g., at the last candle of the previous month or week).
• If disabled, the lines will start from the current bar and extend to the right.
How It Works:
• The script retrieves the high and low prices from your selected previous timeframe and draws two horizontal lines (one for the high and one for the low).
• These lines provide a quick visual reference for key support and resistance levels based on past periods, making it easier to spot potential price action zones.
This tool is designed to be simple and customizable, helping you analyze past levels and make better trading decisions.

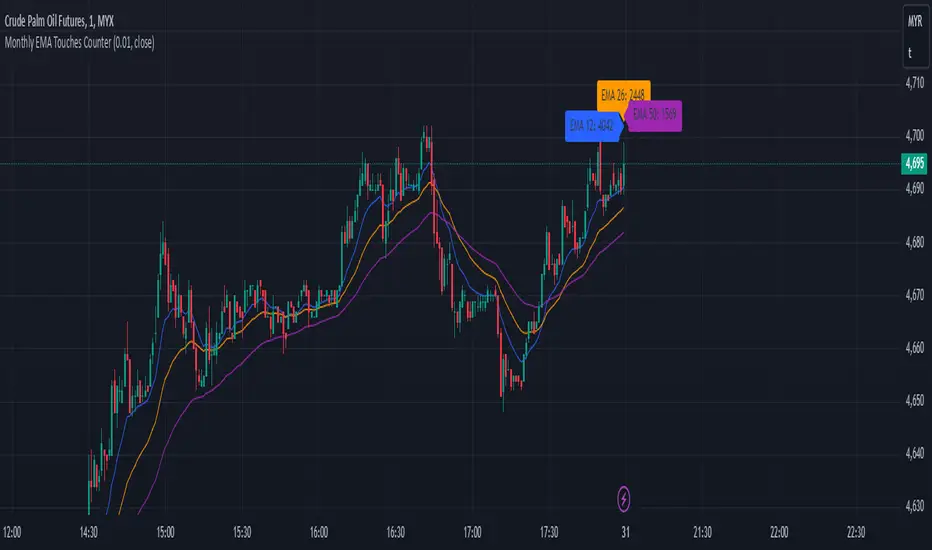
Monthly EMA Touches CounterKey Features of This Script:
Touch Threshold: The script checks if the price is within a specified percentage of each EMA.
Monthly Touch Counters: Separate counters (touchCountEMA12, touchCountEMA26, touchCountEMA50) are used to count touches for each EMA.
Reset Logic: All counters reset at the start of a new month using if ta.change(time("M")).
Increment Logic: Each counter increments whenever the corresponding EMA is touched during a bar.
Label Management: Labels are created to display each count above the bars at the end of each month.
Alert Conditions: Alerts are set up for when the price touches any of the EMAs.
Usage:
Copy and paste this script into TradingView's Pine Script editor.
Add it to your chart to see how many times the price has touched each of the EMAs (12, 26, and 50) on a monthly basis.
Adjust the Touch Threshold (%) input as needed for sensitivity.
This implementation will allow you to effectively track and visualize how often price touches each of these EMAs on a monthly basis. If you have further modifications or additional features you'd like to explore, feel free to ask
Multiple SMA, EMA, and VWAP CrossoversMultiple SMA, EMA, and VWAP Crossovers with Alerts
Overview : The "Multiple SMA, EMA, and VWAP Crossovers" script is designed for traders who want to monitor various simple moving averages (SMAs), exponential moving averages (EMAs), and the volume-weighted average price (VWAP) to identify potential buy and sell opportunities. This script allows you to visualize key moving averages on your chart and create custom alerts for specific crossover events.
Detail s: This script plots the following moving averages:
Simple Moving Averages (SMA): 5, 10, 20, 50, 100, 200, and 325 periods
Exponential Moving Average (EMA): 9 periods
Volume-Weighted Average Price (VWAP)
It includes options to display these moving averages and set alerts for their crossovers.
Available Crossovers:
20/50 SMA, 20/100 SMA, 20/200 SMA, 20/325 SMA
50/100 SMA, 50/200 SMA, 50/325 SMA
100/200 SMA, 100/325 SMA
200/325 SMA
VWAP/20 SMA, VWAP/50 SMA, VWAP/100 SMA, VWAP/200 SMA, VWAP/325 SMA
Optional Lines to Add to the Chart:
9 EMA, 5 SMA, 10 SMA, 20 SMA, 50 SMA, 100 SMA, 200 SMA, 325 SMA, VWAP
How to Use:
Enable Indicators: Use the input options to select which SMAs, EMA, and VWAP you want to display on your chart.
Set Alerts: Choose the specific crossover events you want to monitor. For example, you can set an alert for the 20/50 SMA crossover or the VWAP/100 SMA crossover.
Monitor the Chart: The script will plot the selected moving averages on your chart. When a selected crossover event occurs, an alert will be triggered, notifying you of the potential trade opportunity.
Usage Tips:
Trending Market: Use the buy and sell alerts in trending markets where the moving averages can help confirm the direction of the trend.
Key Support and Resistance Levels: Combine crossover alerts with key support and resistance levels for more reliable trading signals.
Volume Confirmation: Ensure there is sufficient volume to support the crossover signals, indicating stronger momentum behind the move.
When NOT to Use Buy and Sell Alerts:
Low Volume: Avoid using buy and sell alerts during periods of low trading volume, as the signals may be less reliable.
Market Noise: Be cautious in highly volatile markets where frequent crossovers might generate false signals.
Sideways Market: In a sideways or range-bound market, crossover signals can result in multiple whipsaws, leading to potential losses.
Why Use This Script? This script provides a comprehensive tool for traders to monitor multiple moving averages and VWAP crossovers efficiently. It allows you to customize alerts based on your trading strategy and helps you make informed decisions by visualizing key technical indicators on your chart.
Legal Disclaimer: The information provided by this script is for educational and informational purposes only and should not be considered financial advice. The developer of this script is not responsible for any financial losses incurred from using this script.

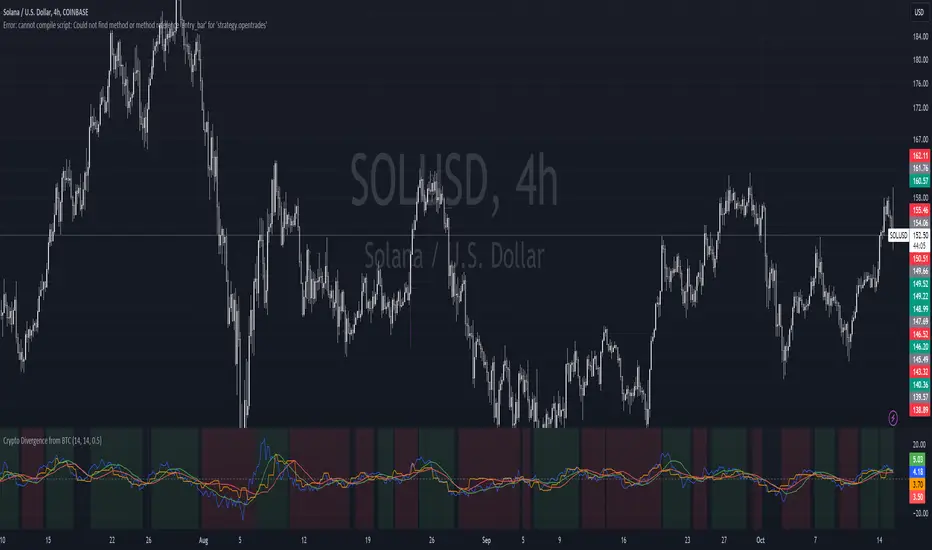
Crypto Divergence from BTCThis script is used to indicate when price action of a crypto coin is diverging significantly from that of BTC.
Explanation of the Script:
Inputs:
roc_length: The period used for calculating the Rate of Change.
ma_length: The period used for the moving average of the ROC.
threshold: The percentage difference that indicates a divergence.
Price Data:
The script retrieves the current asset's price and Bitcoin's price.
ROC Calculation:
The ROC for both the current asset and BTC is calculated based on the defined roc_length.
Moving Averages:
Simple moving averages (SMA) of the ROC values are calculated to smooth out the data.
Divergence Detection:
The indicator checks if the current asset's ROC MA is significantly higher or lower than Bitcoin's ROC MA based on the specified threshold.
Plotting:
The script plots the ROC values and their moving averages.
It also highlights the background in green when a bullish divergence is detected (when the asset is moving up while BTC is lagging) and in red for a bearish divergence.
Stochastics Confluences 4 in 1Description of the Pine Script:
This script plots the Full Stochastic indicator for four different time periods, and highlights conditions where potential buy or sell signals can be identified. The Stochastic indicator measures the position of the current closing price relative to the range of high and low prices over a defined period, helping traders identify overbought and oversold conditions.
Key Features:
Stochastic Calculation for 4 Different Periods:
The script calculates the Stochastic for four separate lookback periods: 9, 14, 40, and 60 bars.
Each Stochastic value is smoothed by a Simple Moving Average (SMA) to reduce noise and provide a clearer signal.
Visual Representation:
It plots each Stochastic value on the chart using different colors, allowing the user to see how the different periods of the indicator behave relative to each other.
Horizontal lines are drawn at 80 (Upper Bound) and 20 (Lower Bound), commonly used to identify overbought and oversold regions.
Highlighting Buy and Sell Conditions:
Green Highlight (Potential Buy Signal):
When all four Stochastic values (for the four different periods) are below 20, this suggests that the asset is in an oversold condition across multiple timeframes. The green background highlight appears when the Stochastic lines converge below 20, indicating a potential buy signal, as the price may be preparing to move upward from an oversold state.
Red Highlight (Potential Sell Signal):
When all four Stochastic values are above 80, the asset is in an overbought condition across multiple timeframes. The red background highlight appears when the Stochastic lines converge above 80, indicating a potential sell signal, as the price may soon reverse downward from an overbought state.
How to Interpret the Signals:
Buy Signals (Green Highlight):
When the chart is highlighted in green, it means the Stochastic indicators for all four periods are below 20, signaling that the asset is oversold and may be nearing a potential upward reversal. This condition suggests a possible buying opportunity, especially when other indicators confirm the potential for an upward trend.
Sell Signals (Red Highlight):
When the chart is highlighted in red, it indicates that the Stochastic indicators for all four periods are above 80, meaning the asset is overbought. This condition signals a possible downward reversal, suggesting a potential selling opportunity if the price begins to show signs of weakness.
By using this script, traders can visually identify periods of strong confluence across different timeframes when the Stochastic indicators are in extreme oversold or overbought conditions, which are traditionally seen as strong buy or sell signals.
This approach helps filter out weaker signals and focuses on moments when all timeframes align, increasing the probability of a successful trade.

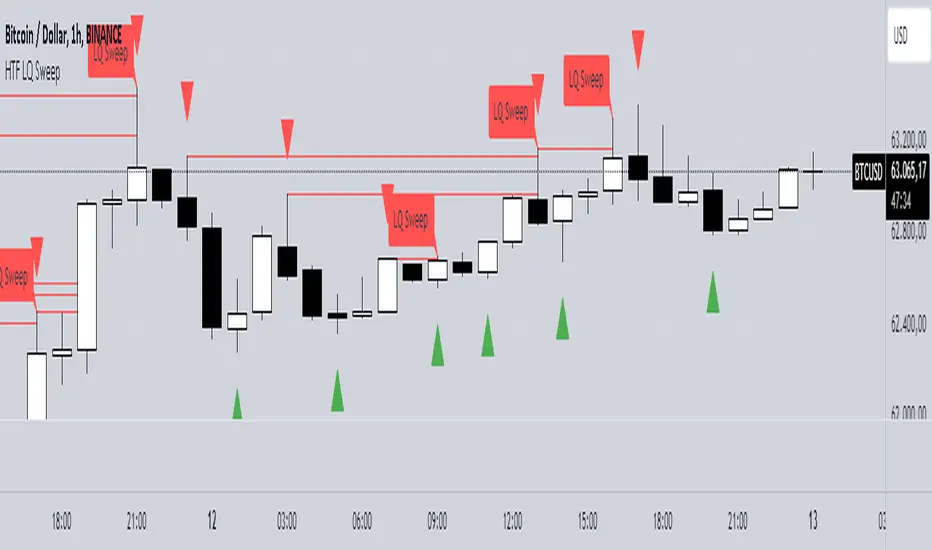
HTF LQ SweepThe following script recognises QL sweeps in the desired time frame with alarm function!
Theory:
There is liquidity above highs and below lows. If this is tapped and the market reacts strongly immediately, the probability of a reversal is greatly increased! In the chart, this is defined in such a way that a candle has its wicks BELOW the old low, but the close is ABOVE the old low. the same applies to the high, of course!
In such a case we have an "LQ Sweep"
How does the script work?
Williams 3 fractals are used as a basis. These are meaningful as lows or highs. Whenever a fractal is created, the price level is saved.
This means that not only the last fractal is relevant, but all historical fractals as long as they have not been reached!
If a candle reaches the level, but shows a rejection and closes within the level again, we have our "LQ Sweep" setup.
In the script you can select the timeframe in which the market has to be analysed. When the QL sweep occurs, an alert is triggered. This saves a lot of time because you can analyse different markets in different timeframes at the same time!
Each QL Sweep is marked in the chart when we are in the selected timeframe. These can also be deactivated so that only the last sweep is displayed.
Benefits for the trader:
An LQ sweep is a nice confirmation for a reversal.
If we have such an LQ sweep, we can wait in the lower timeframe for further confirmation, such as a structural break, to position our entries there.
The alarm function saves us a lot of time and we only go to the chart when a potential setup has been created.
You can set different time frames in the script: The selected time frame is then scanned and sends a signal when the event occurs.
---Advanced Harmonic Pattern Scanner v5Summary of the Script:
All Patterns Covered: The script includes all major harmonic patterns: Butterfly, Gartley, Crab, Bat, Cypher, and Three Drives. Both bullish and bearish versions are detected.
ZigZag Swings: The zigzag logic helps find swing points (X, A, B, C, D) which are essential for forming these patterns. You can adjust the zigzagDepth parameter to fine-tune how sensitive the pattern detection is to price swings.
Fibonacci Levels: Each pattern uses specific Fibonacci retracement or extension levels to identify potential patterns, and the script compares price movements to these ratios.
Visual Aid: It uses plotshape() to display detected patterns on the chart and optional line.new() functions to connect the swing points for a better visual representation of the patterns.
How to Customize:
Timeframe: You can run this script on different timeframes by changing the chart on TradingView (1 min, 1 hour, 1 day, etc.).
ZigZag Sensitivity: Adjust the zigzagDepth to refine how frequently swing points are detected. Larger numbers will reduce sensitivity and show fewer but more pronounced patterns.
Pattern Refinement: Modify Fibonacci levels to experiment with custom harmonic patterns or adjust thresholds for the existing ones.
This code is an advanced version and scans the market comprehensively for all major harmonic patterns. Let me know if you need further modifications or explanations!

Multi-timeframe 24 moving averages + BB+SAR+Supertrend+VWAP █ OVERVIEW
The script allows to display up to 24 moving averages ("MA"'s) across 5 timeframes plus two bands (Bollinger Bands or Supertrend or Parabolic SAR or VWAP bands) each from its own timeframe.
The main difference of this script from many similar ones is the flexibility of its settings:
- Bulk enable/disable and/or change properties of several MAs at once.
- Save 3 of your frequently used templates as presets using CSV text configurations.
█ HOW TO USE
Some use examples:
In order to "show 31, 50, 200 EMAs and 20, 100, 200 SMAs for each of 1H, 4H, D, W, M timeframes using blue for short MA, yellow for mid MA and red for long MA" use the settings as shown on a screenshot below.
In order to "Show a band of chart timeframe MA's of lengths 5, 8, 13, 21, 34, 55, 100 and 200 plus some 1H, 4H, D and W MAs. Be able to quickly switch off the band of chart tf's MAs. For chart timeframe MA's only show labels for 21, 100 and 200 EMAs". You can set TF1 and TF2 to chart's TF and set you fib MAs there and configure fixed higher timeframe MAs using TF3, TF4 and TF5 (e.g. using 1H, D and W timeframes and using 1H 800 in place of 4H 200 MA). However, quicker way may be using CSV - the syntax is very simple and intuitive, see Preset 2 as it comes in the script. You can easily switch chart tf's band of MAs by toggling on/off your chart timeframe TF's (in our example, TF1 and TF2).
The settings are either obvious or explained in tooltips.
Note 1: When using group settings and CSV presets do not forget that individual setting affected will no have any effect. So, if some setting does not work, check whether it is overridden with some group setting or a CSV preset.
Note 2: Sometimes you can notice parts of MA's hanging in the air, not lasting up to the last bar. This is not a bug as explained on this screenshot:
█ FOR DEVELOPERS
The script is a use case of my CSVParser library, which in turn uses Autotable library, both of which I hope will be quite helpful. Autotable is so powerful and comprehensive that you will hardly ever wish to use normal table functions again for complex tables.
The indicator was inspired by Pablo Limonetti's url=https://www.tradingview.com/script/nFs56VUZ/]Multi Timeframe Moving Averages and Raging @RagingRocketBull's # Multi SMA EMA WMA HMA BB (5x8 MAs Bollinger Bands) MAX MTF - RRB

Pink's Daily SMA Script🚗 This script provides a customizable overlay of seven simple moving averages (SMAs) on the chart. Users can control the display of each SMA by toggling them on or off. The lengths of these SMAs are adjustable, allowing for tailored analysis based on individual preferences.
📊 The script calculates daily SMA values using the request.security() function and plots them as horizontal lines on the chart. These SMAs are updated once per day, typically at the start of the pre-market session (9:00 AM in the "America/New_York" timezone). The script resets the SMA values at the start of each new day, ensuring fresh data for daily analysis.
🕒 In addition to the SMAs, the script includes an optional feature that highlights specific time ranges on the chart: from 11:00 AM to 11:05 AM and from 1:00 PM to 1:30 PM (based on the "America/New_York" timezone). Users can toggle these background highlights on or off, providing visual cues for key times during the trading day. The 11:00 AM window is highlighted in gray, while the 1:00 PM window is highlighted in blue.
🔖 The SMAs are labeled on the right side of the chart, with only one label visible at a time for each SMA. These labels display the length of the respective SMA, and their colors match the lines drawn on the chart, helping to distinguish between the different SMAs.
Special thanks to Pinks333 (www.tradingview.com)
Who provided the logic for the script and was willing to share her logic and open source the script.

Dynamic Jurik RSX w/ Fisher Transform█ Introduction
The Dynamic Jurik RSX with Fisher Transform is a powerful and adaptive momentum indicator designed for traders who seek a non-laggy view of price movements. This script is based on the classic Jurik RSX (Relative Strength Index). It also includes features such as the dynamic overbought and oversold limits, the Inverse Fisher Transform, trend display, slope calculations, and the ability to color extremes for better clarity.
█ Key Features:
• RSX: The Relative Strength Index (RSX) in this script is based on Jurik’s RSX, which is smoother than the traditional RSI and aims to reduce noise and lag. This script calculates the RSX using an exponential smoothing technique and adaptive adjustments.
• Inverse Fisher Transform: This script can optionally apply the Inverse Fisher Transform to the RSX, which helps to normalize the RSX values, compressing them between -1 and 1. The inverse transformation makes it easier to spot extreme values (overbought and oversold conditions) by enhancing the visual clarity of those extremes. It also smooths the curve over a user-defined period in hopes of providing a more consistent signal.
• Dynamic Limits: The dynamic overbought and oversold limits are calculated based on the RSX's recent high and low values. The limits adjust dynamically depending on market conditions, making them more relevant to current price action.
• Slope Display: The slope of the RSX is calculated as the rate of change between the current and previous RSX value. The slope is displayed as dots when the slope exceeds the threshold designated by the user, providing visual cues for momentum shifts.
• Trend Coloring: Optionally, the user can also enable a trend-based display. It is simply based on current value of RSX versus the previous one. If RSX is rising then the trend is bullish, if not, then the trend is bearish.
• Coloring Extremes: Users can configure the RSX to color the chart when prices enter extreme conditions, such as overbought or oversold zones, providing visual cues for market reversals.
█ Attached Chart Notes:
• Top Panel: Enabled dynamic limits, Trend display, standard Jurik RSX with 20 lookback period, and Slope display.
• Middle Panel: Enabled dynamic limits, Extremes display, and standard Jurik RSX with 20 lookback period.
• Bottom Panel: Enabled dynamic limits, Trend display, Inverse Fisher Transform with 14 lookback period and 9 smoothing period. and Slope display.
█ Credits:
Special thanks to Everget for providing the original script. The script was also slightly modified based on updates from outside sources.
█ Disclaimer:
This script is for educational purposes only and should not be considered financial advice. Always conduct your own research and consult a professional before making any trading decisions.

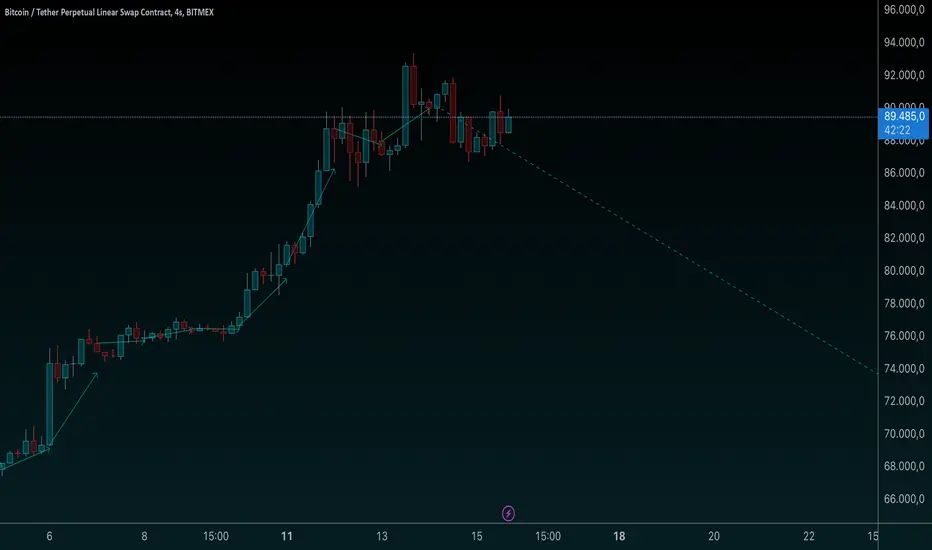
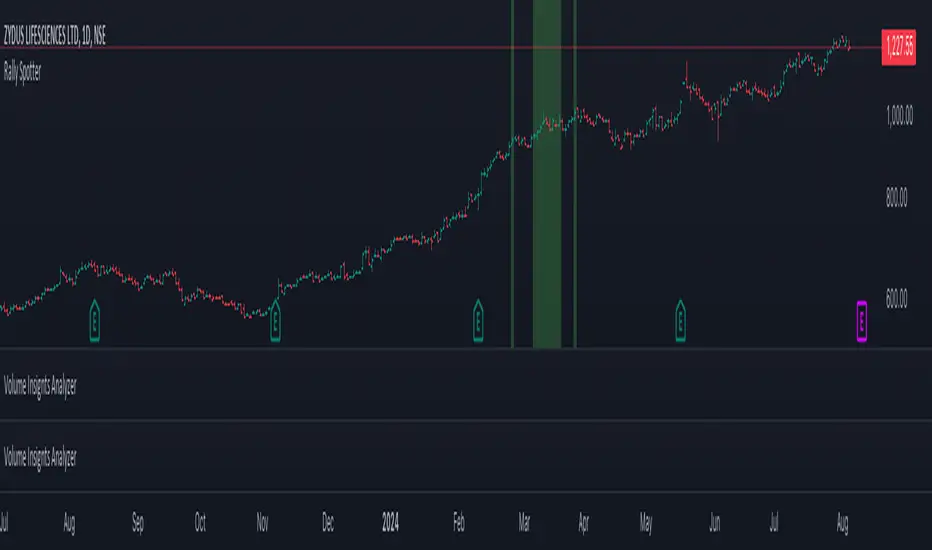
Rally SpotterTitle: Long-Side Rally Detector – Quickly Spot Significant Upward Movements for In-Depth Analysis
Description:
Introducing the Long-Side Rally Detector or Rally Spotter, a powerful Pine Script designed to help traders and investors quickly identify areas on a chart where stocks have made significant upward rallies. This tool is perfect for anyone looking to easily locate these areas and conduct a deep study of the chart to uncover the underlying dynamics of these movements.
Purpose:
The primary goal of the Long-Side Rally Detector is to facilitate the identification of significant rallies, allowing you to delve deeper into the chart and gain valuable insights into market behavior. Once such an area is identified, you can perform a detailed analysis to understand:
When the Move Started: Pinpoint the exact moment the rally began.
How the Move Started: Analyze the initial triggers and catalysts for the upward movement.
The Chart Structure Before the Move: Examine the technical patterns and formations preceding the rally.
How the Volume Looked Like: Assess the volume dynamics and determine whether there was strong buying interest.
What Were the EPS, Sales Figures Before and After the Move: Investigate the fundamental metrics, such as earnings per share (EPS) and sales, to see how they align with the price movement.
Features:
Customizable Percentage Move: Set your preferred percentage increase to detect rallies, with a default value of 50%. This flexibility allows you to tailor the tool to various market conditions and trading strategies.
Adjustable Lookback Period: Define the lookback period in months (default is 3 months) to capture significant trends. The script intelligently adjusts the lookback period based on your chart's timeframe, whether daily, weekly, or monthly.
Focused on Upward Movements: Specifically engineered to identify long-side rallies, ensuring you capture only the most promising upward trends in stock prices.
Visual Highlighting: The script highlights areas on the chart where the stock has made the specified upward move, providing a clear and intuitive visual cue for analysis.
How to Use:
Apply the Script: Add the Long-Side Rally Detector to your TradingView chart.
Customize Settings: Use the input panel to adjust the percentage move and lookback period to fit your analysis needs.
Analyze with Confidence: Utilize the visual cues to identify significant upward movements and make informed trading decisions.
Ideal For:
Traders seeking to capitalize on momentum and trend-following strategies.
Investors looking to identify potential breakout opportunities in their portfolios.
Analysts interested in enhancing their technical analysis toolkit with a precise and customizable indicator.
Unlock the potential of your trading strategy with the Long-Side Rally Detector and stay ahead of the market by spotting key upward movements with ease! Conduct in-depth studies of identified areas to gain a comprehensive understanding of market dynamics.
nPOC Levels by Tyler### Explanation of the Pine Script
This Pine Script identifies and displays weekly naked Points of Control (nPOCs) on a TradingView chart. An nPOC represents a Point of Control (POC) from a previous week that has not been revisited by price action in subsequent weeks. These nPOCs are extended to the right as horizontal lines, indicating potential support or resistance levels.
#### Script Overview
1. **Indicator Declaration:**
```pinescript
//@version=5
indicator("Weekly nPOCs", overlay=true)
```
- The script is defined as a version 5 Pine Script.
- The `indicator` function sets the script's name ("Weekly nPOCs") and specifies that the indicator should be overlaid on the price chart (`overlay=true`).
2. **Function to Calculate POC:**
```pinescript
f_poc(_hl2, _vol) =>
var float vol_profile = na
if (na(vol_profile))
vol_profile := array.new_float(100, 0.0)
_bin_size = (high - low) / 100
for i = 0 to 99
if _hl2 >= low + i * _bin_size and _hl2 < low + (i + 1) * _bin_size
array.set(vol_profile, i, array.get(vol_profile, i) + _vol)
max_volume = array.max(vol_profile)
poc_index = array.indexof(vol_profile, max_volume)
poc_price = low + poc_index * _bin_size + _bin_size / 2
poc_price
```
- The function `f_poc` calculates the Point of Control (POC) for a given period.
- It takes two parameters: `_hl2` (the average of the high and low prices) and `_vol` (volume).
- A volume profile array (`vol_profile`) is initialized to store volume data across different price bins.
- The price range between the high and low is divided into 100 bins (`_bin_size`).
- The function iterates over each bin, accumulating the volumes for prices within each bin.
- The bin with the maximum volume is identified as the POC (`poc_price`).
3. **Variables to Store Weekly Data:**
```pinescript
var float poc = na
var float prev_poc = na
var line poc_lines = na
if na(poc_lines)
poc_lines := array.new_line(0)
```
- `poc` stores the current week's POC.
- `prev_poc` stores the previous week's POC.
- `poc_lines` is an array to store lines representing nPOCs. The array is initialized if it is `na` (not initialized).
4. **Calculate Weekly POC:**
```pinescript
is_new_week = ta.change(time('W')) != 0
if (is_new_week)
prev_poc := poc
poc := f_poc(hl2, volume)
if not na(prev_poc)
line new_poc_line = line.new(x1=bar_index, y1=prev_poc, x2=bar_index + 100, y2=prev_poc, color=color.red, width=2)
label.new(x=bar_index, y=prev_poc, text="nPOC", style=label.style_label_down, color=color.red, textcolor=color.white)
array.push(poc_lines, new_poc_line)
```
- `is_new_week` checks if the current bar is the start of a new week using the `ta.change(time('W'))` function.
- If it's a new week, the previous week's POC is stored in `prev_poc`, and the current week's POC is calculated using `f_poc`.
- If `prev_poc` is not `na`, a new line (`new_poc_line`) representing the nPOC is created, extending it to the right (for 100 bars).
- A label is created at the `prev_poc` level, marking it as "nPOC".
- The new line is added to the `poc_lines` array.
5. **Remove Old Lines:**
```pinescript
if array.size(poc_lines) > 52
line.delete(array.shift(poc_lines))
```
- This section ensures that only the last 52 weeks of nPOCs are kept to avoid cluttering the chart.
- If the `poc_lines` array contains more than 52 lines, the oldest line is deleted using `array.shift`.
6. **Plot the Current Week's POC as a Reference:**
```pinescript
plot(poc, title="Current Weekly POC", color=color.blue, linewidth=2, style=plot.style_line)
```
- The current week's POC is plotted as a blue line on the chart for reference.
#### Summary
This script calculates and identifies weekly Points of Control (POCs) and marks them as nPOCs if they remain untouched by subsequent price action. These nPOCs are displayed as horizontal lines extending to the right, providing traders with potential support or resistance levels. The script also manages the number of lines plotted to maintain a clear and uncluttered chart.

Futures Settlement [NeoButane]Traders use settlement prices as both support/resistance and as a target for price to trend towards. The intention of this script is to provide possible entry and exit levels for swing and scalp trades by drawing horizontal lines of true settlement prices provided by TradingView.
The settlement price, which is calculated daily, is used to determine the profit/loss of a trader's futures position. Prior to the daily close, price settlement of futures contracts is performed by taking the average of its traded price during a specified period of time.
Usage
The settlement prices, shown as horizontal lines, serve as support or resistance for entry or exit. There are hundreds of ways to combine this with favorite indicators, or it can be used as levels for pure price action traders.
See how settlement price levels can be used in confluence with oscillators.
Configuration
Toggles to show each settlement. Reprint shows prior weeks or months after they've ended. Back-adjusted futures, which affect expired futures price history on continuous futures charts, should only be enabled on non-standard charts to match the user's chart settings.
What this script does
This script plots the daily, weekly, and monthly settlements for futures, including an average for the two most recent weekly or monthly settlements. The weekly settlement uses the last day of the week's daily settlement and the monthly settlement uses the last day of the month's daily settlement. For symbols that do not have settlement prices, which will be almost if not all symbols that are not futures, the settlement price instead becomes price at the last second before the daily/weekly/monthly close. In those cases, this script becomes a tool for automatically plotting daily/weekly/monthly closes.
See below for two different bitcoin charts. The chart on top is a non-futures chart and a futures chart is at the bottom. Note that CME bitcoin futures settle 4 hours (1500 CST) before bitcoin's daily close (UTC).
How this script works
TradingView has a built-in ability to display daily settlements instead of the actual daily close. This can be enabled in chart settings for futures on the daily timeframe and there is an argument for Pine Script to do so as well. Because settlement times are different for multiple products during the day, the script uses the settlement price from daily timeframe, which is guaranteed to be correct because TradingView is wonderful. I accidentally found the undocumented backadjustment and settlement_at_close when I was trying to use ticker.inherit() to create a symbol with its daily close time changed to another symbol's, which I still haven't figured out. TradingView has since added documentation for both of them, but there's still an ambiguous 'etc.' in the description of ticker.inherit() so maybe there's more secret arguments...
The script is able to be used on non-standard charts by using ticker.standard(), but back-adjustment will need to be changed by input to match chart settings.
References
Investopedia explanation of settlement price.
www.investopedia.com
Settlement prices for ES.
www.cmegroup.com
CME summary of settlement price.
www.cmegroup.com
How to enable settlement price as close for daily intervals in TradingView. This does not affect the use of this script.
www.tradingview.com
About back-adjustment for continuous futures charts in TradingView.
www.tradingview.com

Gaussian Weighted Moving Average with Forecast [CHE]Presentation for TradingView: Gaussian Weighted Moving Average with Forecast
Introduction
Welcome to our presentation on the "Gaussian Weighted Moving Average with Forecast" (GWMA). This script, written in Pine Script™, offers an enhanced method for analyzing and predicting price movements on TradingView. The script combines Gaussian Weighted Moving Averages and polynomial regression to provide accurate and customizable forecasts.
Overview
Title: Gaussian Weighted Moving Average with Forecast
Author: chervolino
License: Mozilla Public License 2.0
Main Features
1. Gaussian Weighted Moving Average (GWMA):
- Calculates a weighted moving average using a Gaussian weighting function.
- Parameters for length and standard deviation allow fine-tuning of the smoothing effect.
2. Polynomial Regression with Forecast:
- Creates a model to predict future price movements.
- Adjustable length and degree of polynomial regression.
- Option to extrapolate predictions and visualize them.
3. Visual Representation:
- Uses lines and colors to depict trend changes.
- Customizable colors for upward and downward trends.
Input Parameters
Length: Length of the moving average (default: 50)
Standard Deviation: Standard deviation for Gaussian weighting (default: 10.0)
Width: Width of the plotted lines (default: 1)
Colors: Customizable colors for upward and downward trends
Forecast Length: Length of the forecast period (default: 20)
Extrapolate Length: Length of the extrapolation (default: 50)
Polynomial Degree: Degree of the polynomial regression (default: 3)
Lock Forecast: Option to lock and stabilize the forecast
Core Algorithms
1. Gaussian Weight Calculation:
gaussian_weight(x, std_dev) =>
1 / (std_dev * math.sqrt(2 * math.pi)) * math.exp(-0.5 * math.pow(x / std_dev, 2))
2. GWMA Calculation:
calculate_gwma(length, std_dev) =>
// Algorithm to calculate the weighted moving average
3. Initialize Lines for Polynomial Regression:
initialize_lines_array(extrapolate, length) =>
// Initialize array lines
4. Create Design Matrix for Polynomial Regression:
get_design_matrix(length, degree) =>
// Create the design matrix
5. Calculate and Plot Polynomial Regression:
calculate_polynomial_regression(src, length, degree, extrapolate, lines_arr, lock, width, upward_color, downward_color) =>
// Algorithm to calculate polynomial regression and plot the forecast
Combining Indicators: Originality and Usefulness
The combination of Gaussian Weighted Moving Average and polynomial regression provides traders with a robust tool for trend analysis and prediction. The GWMA smooths out price data while emphasizing recent prices, making it sensitive to short-term trends. Polynomial regression, on the other hand, offers a mathematical approach to model and forecast future prices based on historical data. By integrating these two methodologies, traders can achieve a more comprehensive view of market trends and potential future movements, making the tool highly valuable for decision-making.
Explanation for Users
Most TradingView users are not familiar with Pine Script, so a clear description is essential for understanding how to use the script.
Gaussian Weighted Moving Average (GWMA): This indicator calculates a moving average using Gaussian weights, which gives more importance to recent prices. The length and standard deviation parameters allow users to control the sensitivity and smoothness of the average.
Polynomial Regression with Forecast: This feature uses polynomial regression to model the price trend and predict future movements. Users can adjust the length of the historical data used, the degree of the polynomial, and the length of the forecast. The script plots these predictions, making it easier for traders to visualize potential future price paths.
Visualization of Results
1. GWMA Plotting:
plot(gaussian_ma_result, title="GWMA", color=line_color, linewidth=width_input)
2. Forecast Extrapolation:
plot(forecast_val, 'Extrapolation', offset=extrapolate_setting, linewidth=width_input, style=plot.style_circles)
Conclusion
The "Gaussian Weighted Moving Average with Forecast" script provides a powerful tool for analyzing and predicting price movements on TradingView. By combining Gaussian weighting and polynomial regression, it offers a precise and customizable method for trend analysis and forecasting.
Thank you for your attention! For any questions or further information, please feel free to reach out.
